Asd

Thursday, June 23, 2011

Different SQL Script for finding Last Backup History for All Database.

Below script is very helpful when you need to find last backups, physical device, and backup size for a database.

The msdb system database is the primary repository for storage of SQL Agent, backup, Service Broker, Database Mail, Log Shipping, restore, and maintenance plan metadata.

We can get all the information for this task out of below msdb System Table: 

      msdb.dbo.backupset.  - Provides information concerning the most-granular details of the backup process .The important columns of note for this object are itemized below.  Asterisks denote the columns we'll be using in this query:
§  database_name - name of the database the backup file pertains to.
§  type - Type of backup process performed:
·         D = Database
·         F = File or Filegroup
·         G = Differential File
·         I = Differential (database)
·         L = Transaction Log
§  backup_finsh_date - time when the backup process completed.
§  backup_start_date - time the backup process was initiated.
§  name - name of the backupset
§  user_name - user performing the backup process
§  expiration_date - date the backup expires

 
SQL Scripts 1

SELECT
      sys.sysdatabases.Name AS DATABASE_NAME,
      COALESCE(CONVERT(VARCHAR(12),MAX(msdb.dbo.backupset.backup_finish_date), 101),'NEVER') AS LAST_DATABASE_BACKUP_DATE
FROM
      sys.sysdatabases
      LEFT OUTER JOIN msdb.dbo.backupset
      ON msdb.dbo.backupset.database_name = sys.sysdatabases.name
GROUP BY
      sys.sysdatabases.Name 

SQL Scripts 2

SELECT
      msdb.dbo.backupmediafamily.physical_device_name AS FILE_LOCATION,
      msdb.dbo.backupset.database_name AS DATABASE_NAME,
      CAST(CAST(msdb.dbo.backupset.backup_size / 1000000 AS INT) AS VARCHAR(14))+ ' ' + 'MB'  AS BACKUP_SIZE,
      CAST(DATEDIFF(second, msdb.dbo.backupset.backup_start_date,      msdb.dbo.backupset.backup_finish_date) AS VARCHAR(4)) + ' '+ 'Seconds' AS BACKUP_TIME_TAKEN,
      msdb.dbo.backupset.backup_start_date AS BACKUP_DATE_TIME,
      CASE msdb.dbo.backupset.[type]
      WHEN 'D' THEN 'Full'
      WHEN 'I' THEN 'Differential'
      WHEN 'L' THEN 'Transaction Log'
      END AS BACKUP_TYPE,
      msdb.dbo.backupset.server_name AS SERVER_NAME
FROM
      msdb.dbo.backupset
      INNER JOIN msdb.dbo.backupmediafamily 
      ON msdb.dbo.backupset.media_set_id = msdb.dbo.backupmediafamily.media_set_id

SQL Scripts 3

SELECT
      ISNULL(STR(ABS(DATEDIFF(day, GetDate(),MAX(Backup_finish_date)))), 'NEVER') AS DAY_LAST_BACKUP_TAKEN,
      master.dbo.sysdatabases.name AS DATABASE_NAME,
      ISNULL(Convert(char(10), MAX(backup_finish_date), 101), 'NEVER') AS LAST_BACKUP_DATE
FROM
      master.dbo.sysdatabases
      LEFT OUTER JOIN msdb.dbo.backupset
      ON msdb.dbo.backupset.database_name = master.dbo.sysdatabases.name
      AND msdb.dbo.backupset.type = 'D'
GROUP BY
      master.dbo.sysdatabases.Name

SQL Scripts 4

SELECT
      database_id AS DATABASE_ID,
      convert(varchar(25), sys.databases.name) AS DATABASE_NAME,
      convert(varchar(10), Databasepropertyex(name, 'status')) AS DATABASE_STATUS,
      (SELECT COUNT(1) FROM sys.master_files WHERE DB_NAME(database_id) = sys.databases.name AND type_desc = 'rows') AS DATAFILES ,
      (SELECT SUM((size*8)/1024) FROM sys.master_files WHERE DB_NAME(database_id) = sys.databases.name AND type_desc = 'rows') AS DATA_FILE_SIZE_IN_MB,
      (SELECT COUNT(1) FROM sys.master_files WHERE DB_NAME(database_id) = sys.databases.name AND type_desc = 'log') AS LOG_FILES,
      (SELECT SUM((size*8)/1024) FROM sys.master_files WHERE DB_NAME(database_id) = sys.databases.name AND type_desc = 'log') AS LOG_FILE_SIZE_IN_MB,
      CASE compatibility_level
      WHEN 60 THEN '60 (SQL Server 6.0)'
      WHEN 65 THEN '65 (SQL Server 6.5)'
      WHEN 70 THEN '70 (SQL Server 7.0)'
      WHEN 80 THEN '80 (SQL Server 2000)'
      WHEN 90 THEN '90 (SQL Server 2005)'
      END AS COMPATIBILITY_LEVEL,
      CONVERT(VARCHAR(20), create_date, 103) + ' ' + CONVERT(VARCHAR(20), create_date, 108) AS DATABASE_CREATION_DATE,
      CASE WHEN is_fulltext_enabled = 1 THEN 'Fulltext enabled' ELSE ' ' END AS FULL_TEXT,
      CASE WHEN is_auto_close_on = 1 THEN 'autoclose' ELSE ' ' END AS AUTOCLOSE,
      CASE WHEN is_read_only = 1 THEN 'read only' ELSE ' ' END AS  READ_ONLY,
      CASE WHEN is_auto_shrink_on = 1 THEN 'autoshrink' ELSE ' ' END AS AUTOSHRINK,
      CASE WHEN is_auto_create_stats_on = 1 THEN 'auto create statistics' ELSE ' ' END AS AUTO_CREATE_STATISTICS,
      CASE WHEN is_auto_update_stats_on = 1 THEN 'auto update statistics' ELSE ' ' END AS AUTO_UPDATE_STATISTICS,
      CASE WHEN is_in_standby = 1 THEN 'standby' ELSE ' ' END AS STAND_BY,
      CASE WHEN is_cleanly_shutdown = 1 THEN 'cleanly shutdown' ELSE ' ' END AS CLEANLY_SHOUTDOWN,
      user_access_desc AS USER_ACCESS,
      recovery_model_desc AS  RECOVERY_MODEL
FROM
      sys.databases


Posted by - SUHAS R. KUDEKAR (MCTS - Microsoft Business Intelligence)
Learning Office 2010 + SharePoint 2010 + SQL Server 2008 R2

Monday, May 30, 2011

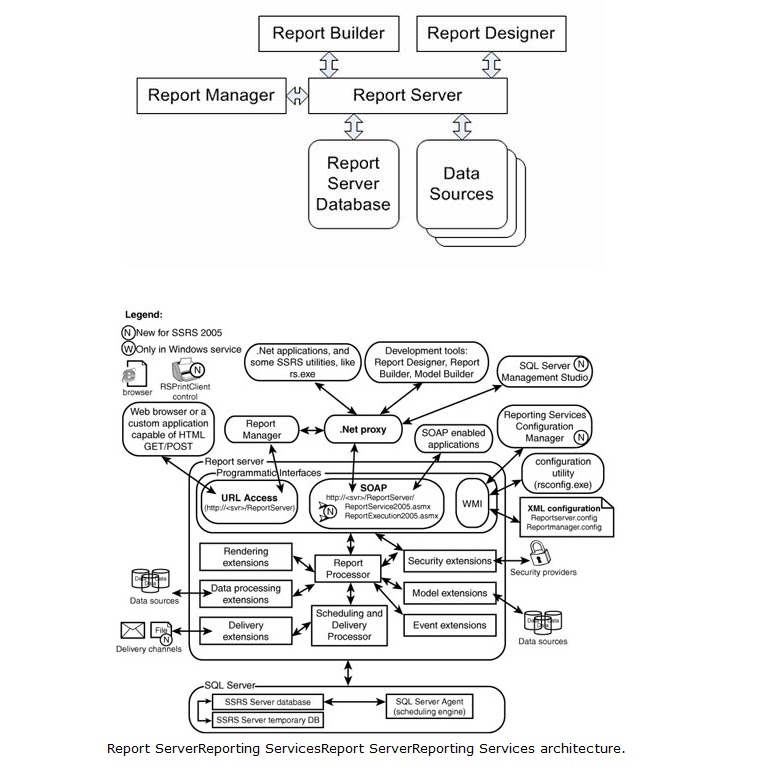
Architecture Diagram of SSAS/SSRS/SSIS Part - 1

Below is the diagrammatically representation of MSBI components

1- SSAS (SQL Server Analysis Services) Architecture Diagram


2- SSAS (SQL Server Integration Services) Architecture Diagram 


3- SSAS (SQL Server Reporting Services) Architecture Diagram

Next Part we can discuss one by one

Posted by - SUHAS R. KUDEKAR (MCTS - Microsoft Business Intelligence)
Learning Office 2010 + SharePoint 2010 + SQL Server 2008 R2 

Wednesday, May 18, 2011

Business Intelligence Semantic Model (BISM)

Analysis Services cubes as we know them today and SSAS+MDX are dead

Microsoft announce in November 2010. Very disappointed because from last 2+ years I am working on SSAS and loving this technology always try new things in SSAS.  

Like me all MSBI Developers now thinking to stay with SSAS+MDX Queries or go with other
Data warehousing technology so from couple of day reading new things.

But Its big reprieve for all those ware worried,  ;-) ;-) ;-)

Microsoft announce the road map for SSAS and good news comes for all the MSBI Developer that SSAS+MDX is Alive with “Denali” as Business Intelligence Semantic Model (BISM) is being introduced in Analysis Services.

What introductions coming in SQL Server “Denali” and the new class of BI applications and update on Analysis Services – Idea & Guideline as Below.


1-It is the foundation of the Microsoft BI stack, serving as the semantic model for Microsoft BI tools including Excel, SharePoint Insights and Reporting Services.

2-This will do this by embracing the relational data model and bringing it together with the multidimensional model under a single unified BI platform – providing the best of both worlds.

3-Business Intelligence Semantic Model is being introduced in Analysis Services for SQL Server “Denali” with the goal to fulfill this vision. Combination of
·         First multidimensional modeling which is capable of tackling the most advanced of BI applications
·         Second one the other hand, the relational data model is widely understood and accepted by developers and IT professionals around the world.

4-When you upgrade your Analysis Services project or server to SQL Server “Denali”, every cube automatically becomes a BI Semantic Model.

5- All client tools in the Microsoft BI stack – Excel, PowerPivot, SharePoint Insights and Reporting Services operate on this model.

6- MSBI professionals can create the model in Visual Studio and deploy it to an Analysis Services server.  Interestingly, the model can also be created by business users with PowerPivot for Excel and shared via PowerPivot for SharePoint.

7-PowerPivot and Analysis Services are two different products but both use the BI Semantic Model under the covers.  
·         PowerPivot - Targets business users and In the case of PowerPivot, the model is embedded inside an Excel workbook
·         Analysis Services - Targets BI professionals and IT and In the case of Analysis Services, the model is stored and managed on the server.

8-UDM (Unified Dimensional Model) is no longer used with SQL Server “Denali” and is subsumed by the BI Semantic Model.

Posted by - SUHAS R. KUDEKAR (MCTS - Microsoft Business Intelligence)
Learning Office 2010 + SharePoint 2010 + SQL Server 2008 R2
 

Monday, May 16, 2011

Error: 4064 – Cannot open user default database. Login failed. Login failed for user…!

This Type of error will occur while you try to connect Sql Server Management studio to access database. You can use the below steps to successfully connect the Sql Server Management studio.


·         Open your Sql Server Management studio.

·         Now you will get the Login option where you need to click on the Options button


·         Click the connection properties tab if it is not active.


·         Click on the Connect to database: dropdown

·         Type in the name of a database that still exists. May master database name need to put.

·         Connect the Sql Server Management studio its working fine

After login we can change/Alter the default database name with command as below.

           ALTER LOGIN [User] WITH DEFAULT_DATABASE = master


Posted by - SUHAS R. KUDEKAR (MCTS - Microsoft Business Intelligence)
Learning Office 2010 + SharePoint 2010 + SQL Server 2008 R2

Monday, May 9, 2011

What tools can we used for OLAP Browser?

What is OLAP?
OLAP (On Line Analytical Processing) performs multidimensional analysis of business data and provides the capability for complex calculations, trend analysis, and sophisticated data modeling. It is quickly becoming the fundamental foundation for Intelligent Solutions including Business Performance Management, Planning, Budgeting, Forecasting, Financial Reporting, Analysis, Simulation Models, Knowledge Discovery, and Data Warehouse Reporting.

It can also be defined as the capability of manipulating and analyzing data from multiple perspectives is widely used in business intelligence, data mining and reporting applications that provide complex analysis of data in a short period of time.

What makes OLAP such a powerful data analysis tool, and why would you want to use it are question that most people ponder when they are first introduced to this technology.
Using OLAP lets you find out:
·         Why one month’s sales were better than another month’s sales?
·         Which product your Sales department selling the most of?
OLAP types can be found in the MOLAP, ROLAP, and HOLAP

Now our main Question is “What tools can we used for OLAP Browser”
Below are the tools for OLAP web browser may be some of miss in the list
·         Dundas
·         BI Companion
·         IntelliMax
·         Panorama
·         Radar-Soft
·         ProClarity
·         Ranet OLAP
·         PerformancePoint

Today we discuss more on Ranet OLAP Browser
Ranet OLAP is an open source set of data visualization controls – powered by Microsoft Silverlight and was written specifically for SQL Server Analysis Services with support for SQL Server. Ranet OLAP is our advanced front-end solution for Microsoft SQL Server Analysis Services.

It can be used for displaying data using most popular Web-browsers: Mozilla Firefox, Google Chrome, and Internet Explorer.


It provides parsing, generating and visualization of MDX language and MDX query results. Moreover it provides data input and Write back to OLAP cube. It works under .NET and Silverlight.
It includes:
-         MDX Document Object Model (MDX DOM)
-         MDX Parser
-         MDX Generator
-         Description of supported MDX Syntax
-         Set of OLAP visual controls for MS Analysis Services:
-         Dynamic Pivot Grid - Pivot Table with WriteBack ability for arbitrary MDX text query
-         MDX Query Designer - visual MDX query builder
-         OLAP metadata explorer
-         Choice controls: CubeChoice, KpiChoice,  MeasureChoice,  LevelChoice,  MemberChoice, etc


Ranet OLAP includes Visual Controls:

·         PIVOT GRID
-          Control shows a summary table which is a result of running the MDX query
-          Sorting – Ascending and Descending sorting can be applied to a row area, column area, or data area in the pivot grid table
-          Members group – grouping data in the row area and column area are in the pivot grid table
-          Show Properties – It can display the property of the dimension member in the table
-          Properties, Custom Properties – show properties of the dimension member or cell, and their current values, in a special window
-          DrillThrought – shows the detailed data used for calculating the indicator value for the cell, in a special window
-          Show MDX – displays the MDX query generated as a result of design, or prepared manually by the user, in a special window
-          Writeback – Editing cube data


·         MDX DESIGNER  
-          Control permits creating interactive reports based on Microsoft Analysis Services OLAP cube data
-          Customer Calculation Editor – a built-in Customer Calculations Editor permits the user to create calculated members and calculated sets on his own
·         Change Filter – to modify the filter, where a list of members included in the report is
Determined
·         MEMBER CHOICE – control serves for selecting one or a number of cube dimension members
·         Find tab – It is a visual element used to determine the search parameters
·         LEVEL CHOICE – control is used for selecting a level in the cube hierarchy.
·         MEASURE CHOICE – control is intended for selecting a cube measure, including selection within a specific measure group


·         KPI CHOICE – control is intended for selecting a Key Performance Indicator (KPI) for the cube
·         DATE PARAMETER – control is intended for selecting a date from a cube time dimension on a calendar form
·         KPI VIEWER – control shows Key Performance Indicators (KPI) defined in the cube, and their basic values at certain time


Why is Ranet OLAP your complete solution OLAP Browser?
ü  Interactive Designer Pivot tables.
ü  Support Functions Drill Down / Up And Drill Through.
ü  Flexible Filter, Sorting, & Groping Data.
ü  Export / Import setting, snapshots of data.
ü  Editing data in the cube via the internet.
ü  Export analysis result to Microsoft Excel.
ü  Easy-to-use UI.


Posted by - SUHAS R. KUDEKAR (MCTS - Microsoft Business Intelligence)
Learning Office 2010 + SharePoint 2010 + SQL Server 2008 R2